Is The Bitcoin Cycle Top In? On-Chain Signals You Need To Know
Bitcoin prices have retreated from Tuesday’s all-time high of $108,353 to around $96,000 (-11.5% retracement), fueling intense speculation whether the current bull cycle is nearing its peak. To address the growing uncertainty, Rafael Schultze-Kraft, co-founder of on-chain analytics provider Glassnode, said: release A post on X details 18 on-chain indicators and models. “Where is the top Bitcoin?” Schulz-Kraft asked, then offered a detailed analysis.
Has Bitcoin reached a cycle top?
1/ MVRV Ratio: A long-term measure of unrealized profitability, MVRV ratio Compare market value to realized value. Historically, a reading above 7 indicates an overheating condition. “There’s room for growth right now that’s hovering around 3,” Schultz-Kraft noted. This suggests that the market has not yet reached levels seen at previous macro tops in terms of total unrealized profits.
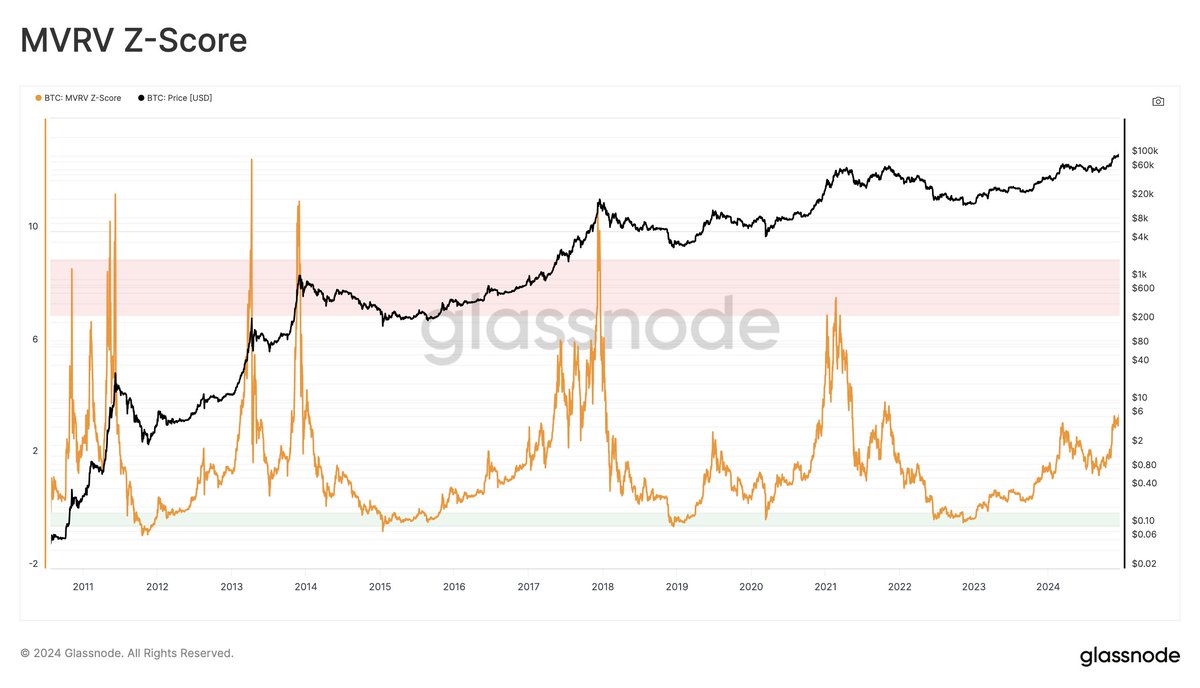
2/ MVRV pricing ranges: These ranges are derived from the number of days when MVRV is at extreme levels. Historically, only about 6% of trading days have broken through the highest range (3.2). Today, this top strap would cost $127,000. With Bitcoin price around $98,000, the market has not yet reached the area that historically marks top formations.
3/ Long-term holders profitability (relative unrealized profits and LTH-NUPL): Long-term holders (LTH) are considered to be more stable market participants. Their net unrealized profit and loss (NUPL) metric currently sits at 0.75, entering what Schultze-Kraft calls the “euphoria zone.” He said that in the 2021 cycle, Bitcoin has risen approximately 3x after reaching similar levels (although he clarified that he does not necessarily expect a repeat). Historically top formations have often seen LTH-NUPL readings above 0.9. So while the indicator has risen, it has not yet reached its previous cycle limits.
It’s worth noting that Schultz-Kraft acknowledged that his observations may be conservative, as the profitability value at the peak of the 2021 cycle is somewhat lower than in previous cycles. “I would expect those profitability metrics to be at slightly higher levels,” he explained. This may indicate a gradual reduction in peaks over successive cycles. Investors should be aware that historical extremes may become less pronounced over time.
4/ Annual realized profit and loss ratio: This indicator measures the ratio of total realized profits to realized losses in the past year. The highest value in the previous cycle has exceeded 700%. Currently around 580%, it still shows “room for growth” before reaching all-time highs.
Related reading
5/ Market Cap to Thermocap Ratio: An early on-chain metric that compares Bitcoin’s total market cap to cumulative mining costs (Thermocap). In previous bull markets, the ratio’s extreme values coincided with market tops. Schultz-Kraft advised caution on specific target ranges but noted that current levels are not yet close to previous extremes. The market remains below historical heat cap multiples indicative of past overheating conditions.
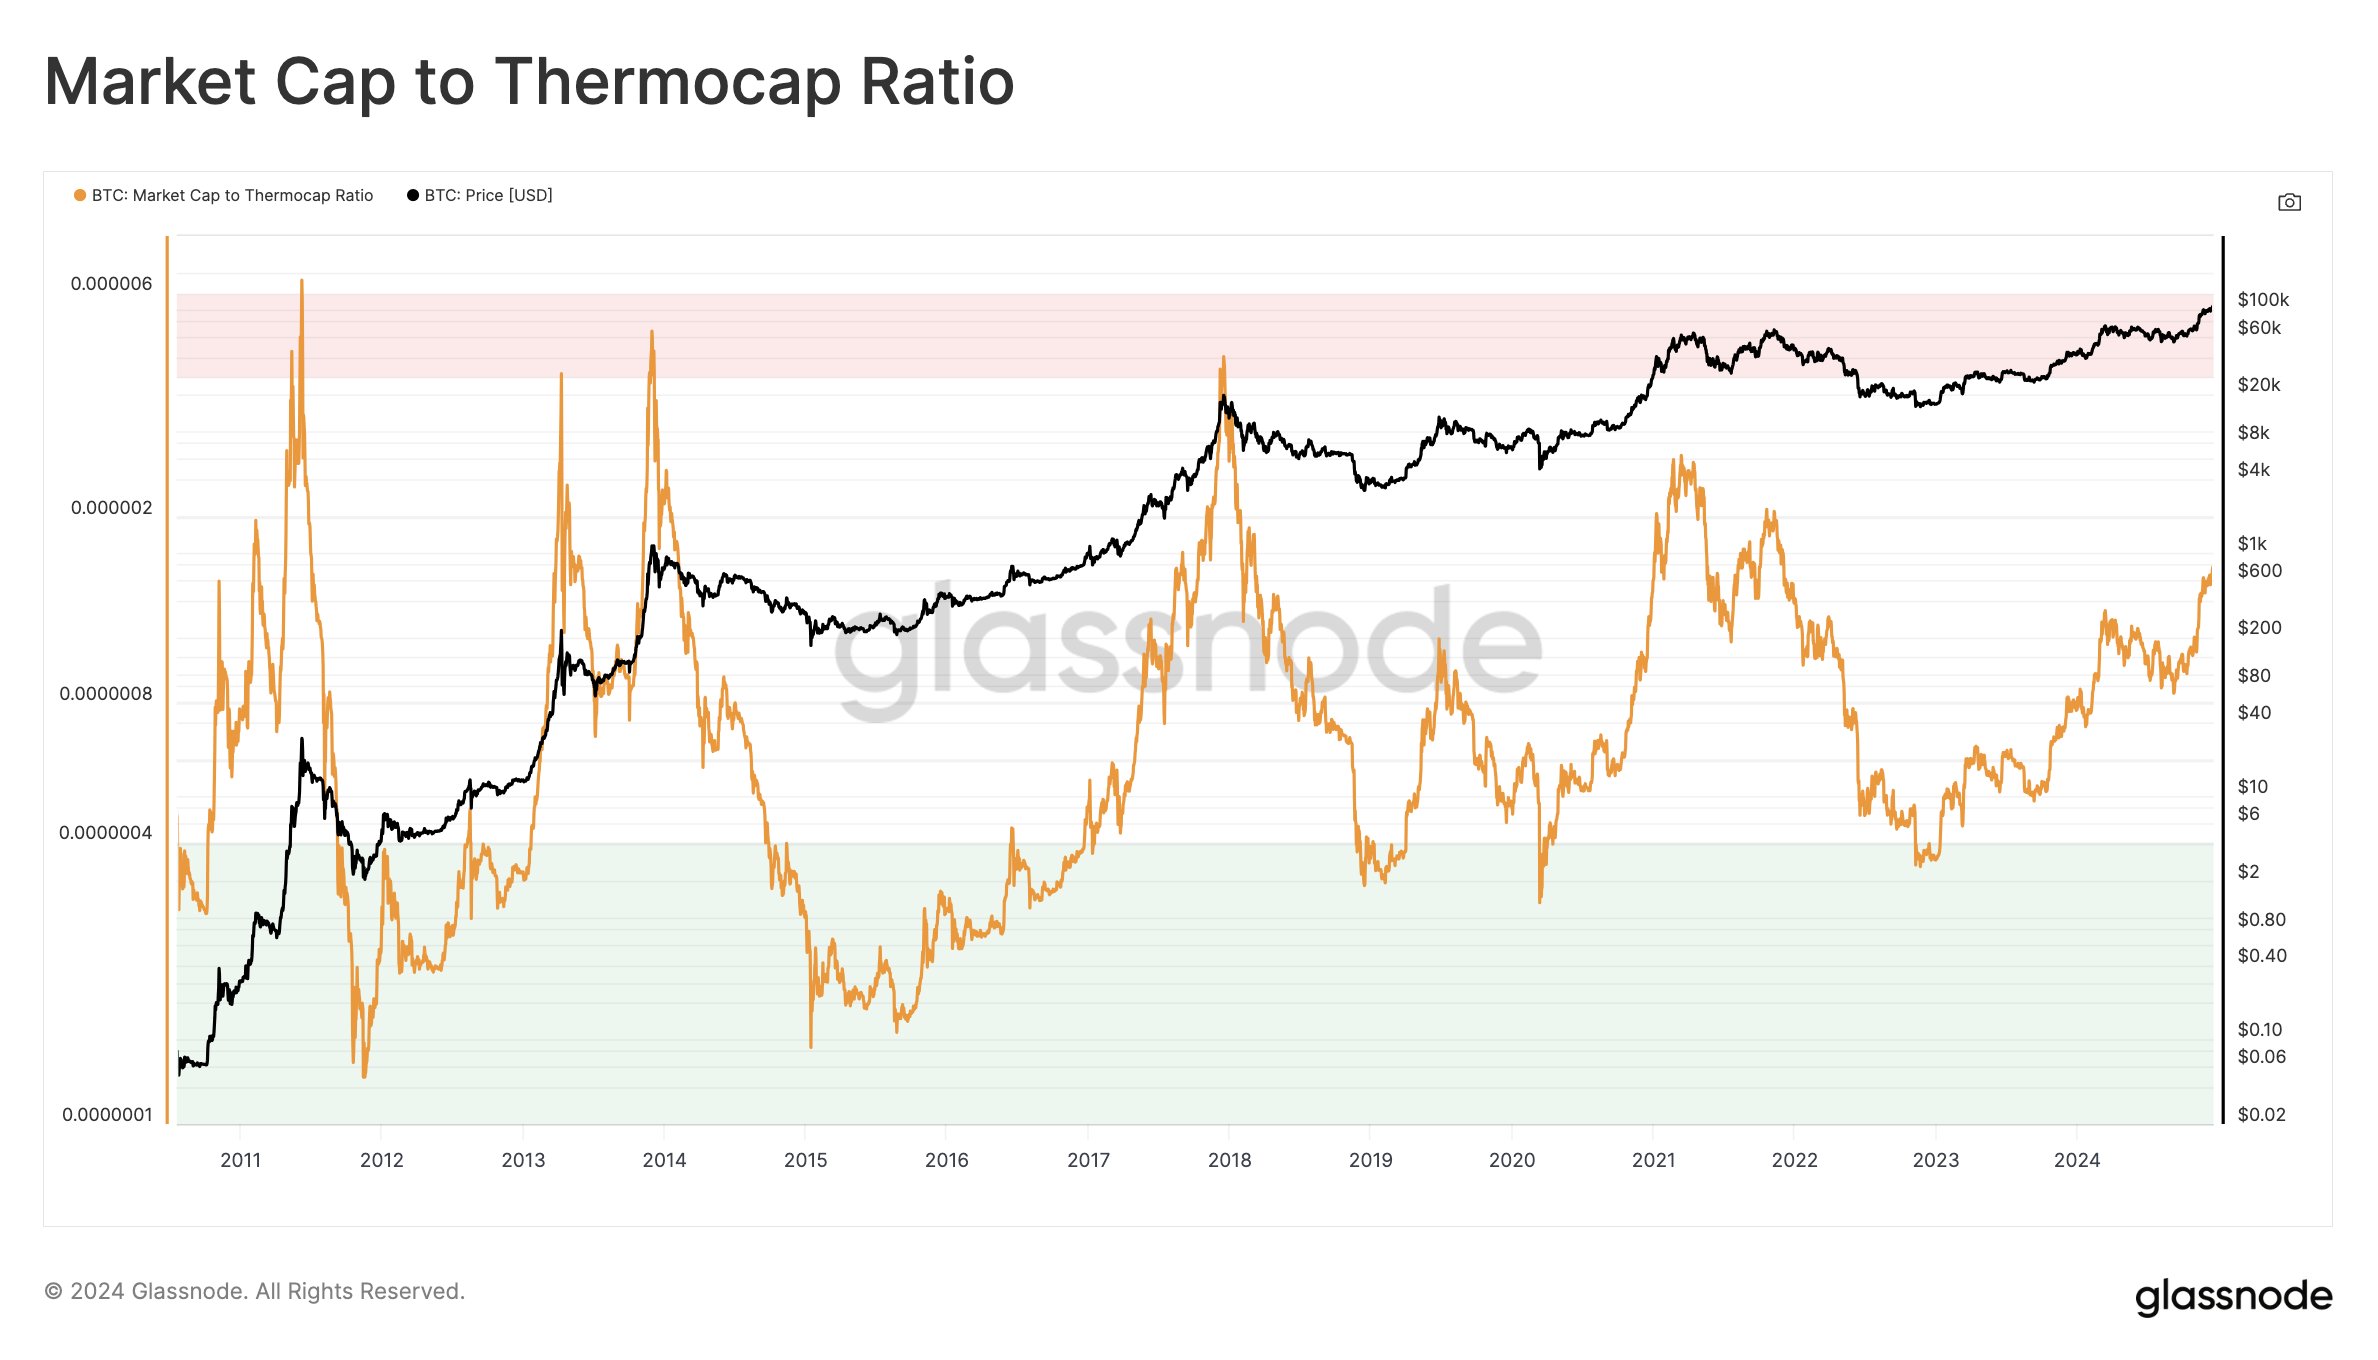
6/ Thermocap multiple (32-64x): Historically, Bitcoin’s highest values were around 32-64x Thermocap. “We’re at the bottom of the spectrum,” Schultz-Kraft said. Hitting the highest range in today’s environment would mean Bitcoin’s market capitalization is just over $4 trillion. Given that the current market capitalization ($1.924 trillion) is significantly lower, this suggests a significant increase is possible if historical patterns hold.
7/ Investor Tool (2-Year SMA x5): The Investor Tool applies the price’s 2-year simple moving average (SMA) and 5x that SMA to indicate potential top areas. “It’s currently worth $230,000,” Schultz-Kraft noted. With Bitcoin currently trading well below this level, the indicator has yet to signal a clear top.
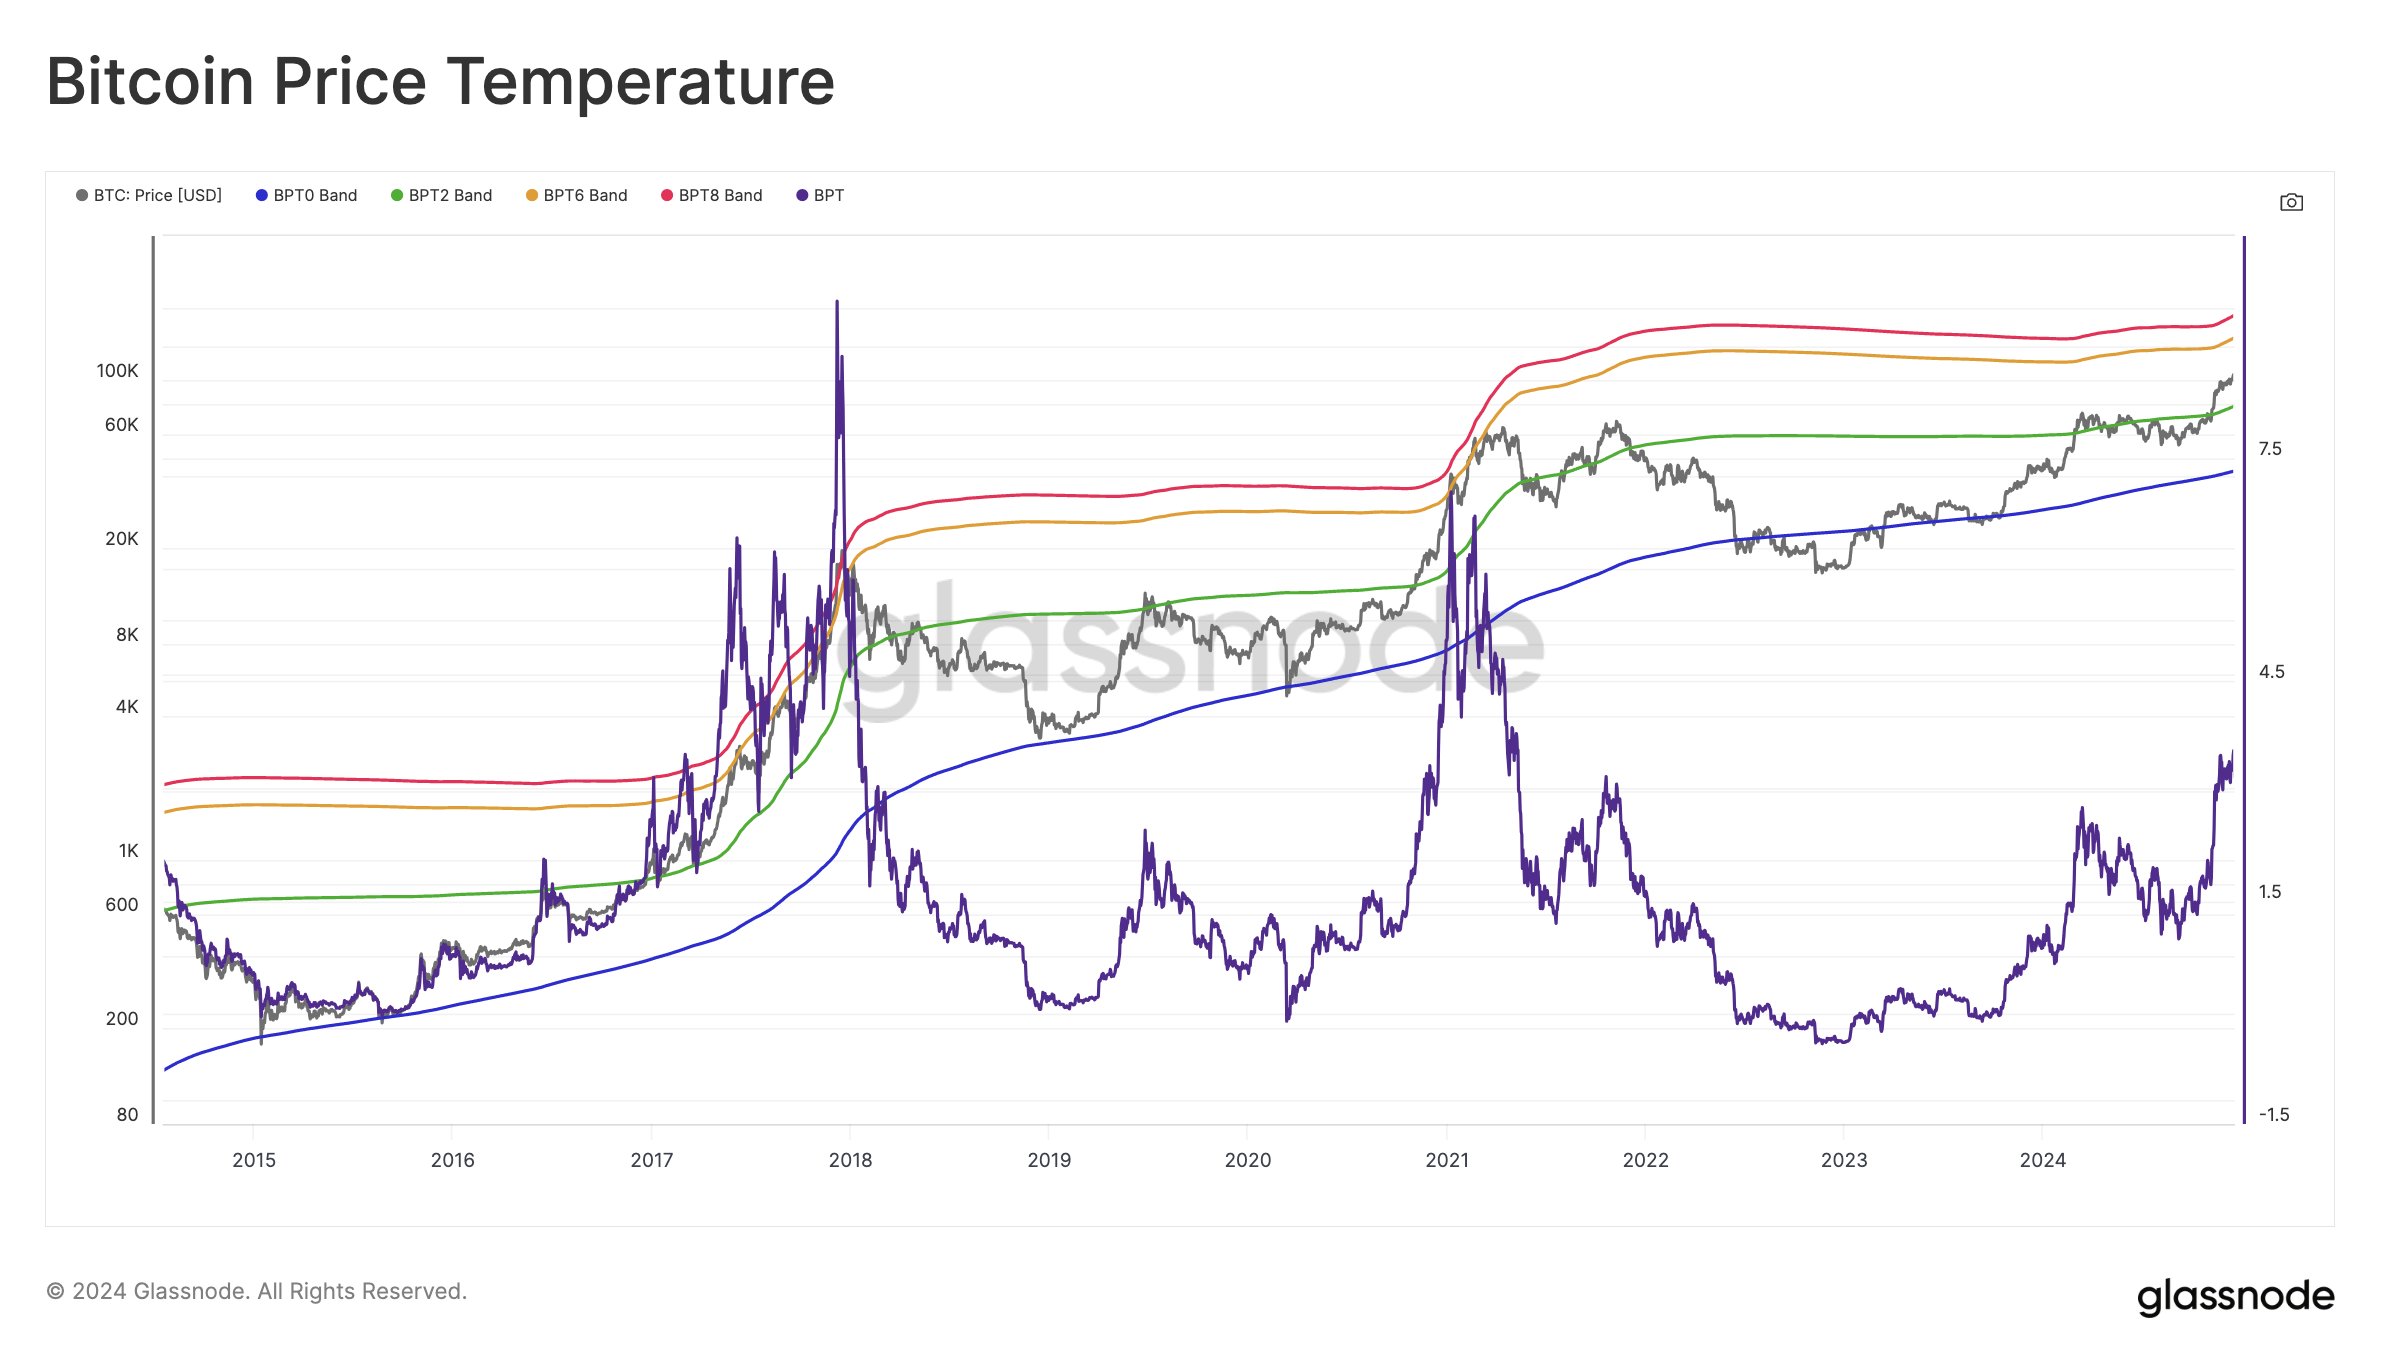
8/ Bitcoin Price Temperature (BPT6): This model uses deviations from the 4-year moving average to capture cyclical price extremes. Historically, BPT6 has been reached in previous bull markets, with this range currently sitting at $151,000. With Bitcoin at $98,000, the market remains below levels previously associated with overheated peaks.
9/ True Market Average and AVIV: The True Market Average is another cost basis model. Its MVRV equivalent is called AVIV, which measures how much the market deviates from this mean. Historically, tops have exceeded 3 standard deviations. Today’s equivalent value is “equivalent to a value higher than ~2.3”, while the current reading is 1.7. Schultz-Kraft said there is “lots of room for growth,” meaning by this metric the market has not yet reached its historical limits.
Related reading
10/Low/Medium/High Market Cap Models (Delta Cap Derivatives): These models are based on the Delta Cap indicator, which has historically shown diminishing value over the 2021 cycle, never reaching the “maximum cap.” Because market structures are constantly changing, Schulz-Kraft urges caution in interpreting these contents. Currently, the mid-cap level is around $4 trillion, roughly 2x current levels. If the market follows the previous pattern, this will allow for substantial growth before reaching the levels characteristic of the early top.
11/ Value Days Destroyed Multiple (VDDM): This metric measures the spending behavior of long-term token holdings relative to the annual average. Historically, extreme values above 2.9 indicate an influx of older coins into the market, usually late in a bull market. It is currently 2.2, which has not yet reached extreme levels. Schultz-Kraft noted that “there’s room for growth,” suggesting that not all long-term holders have completely succumbed to profit-taking.
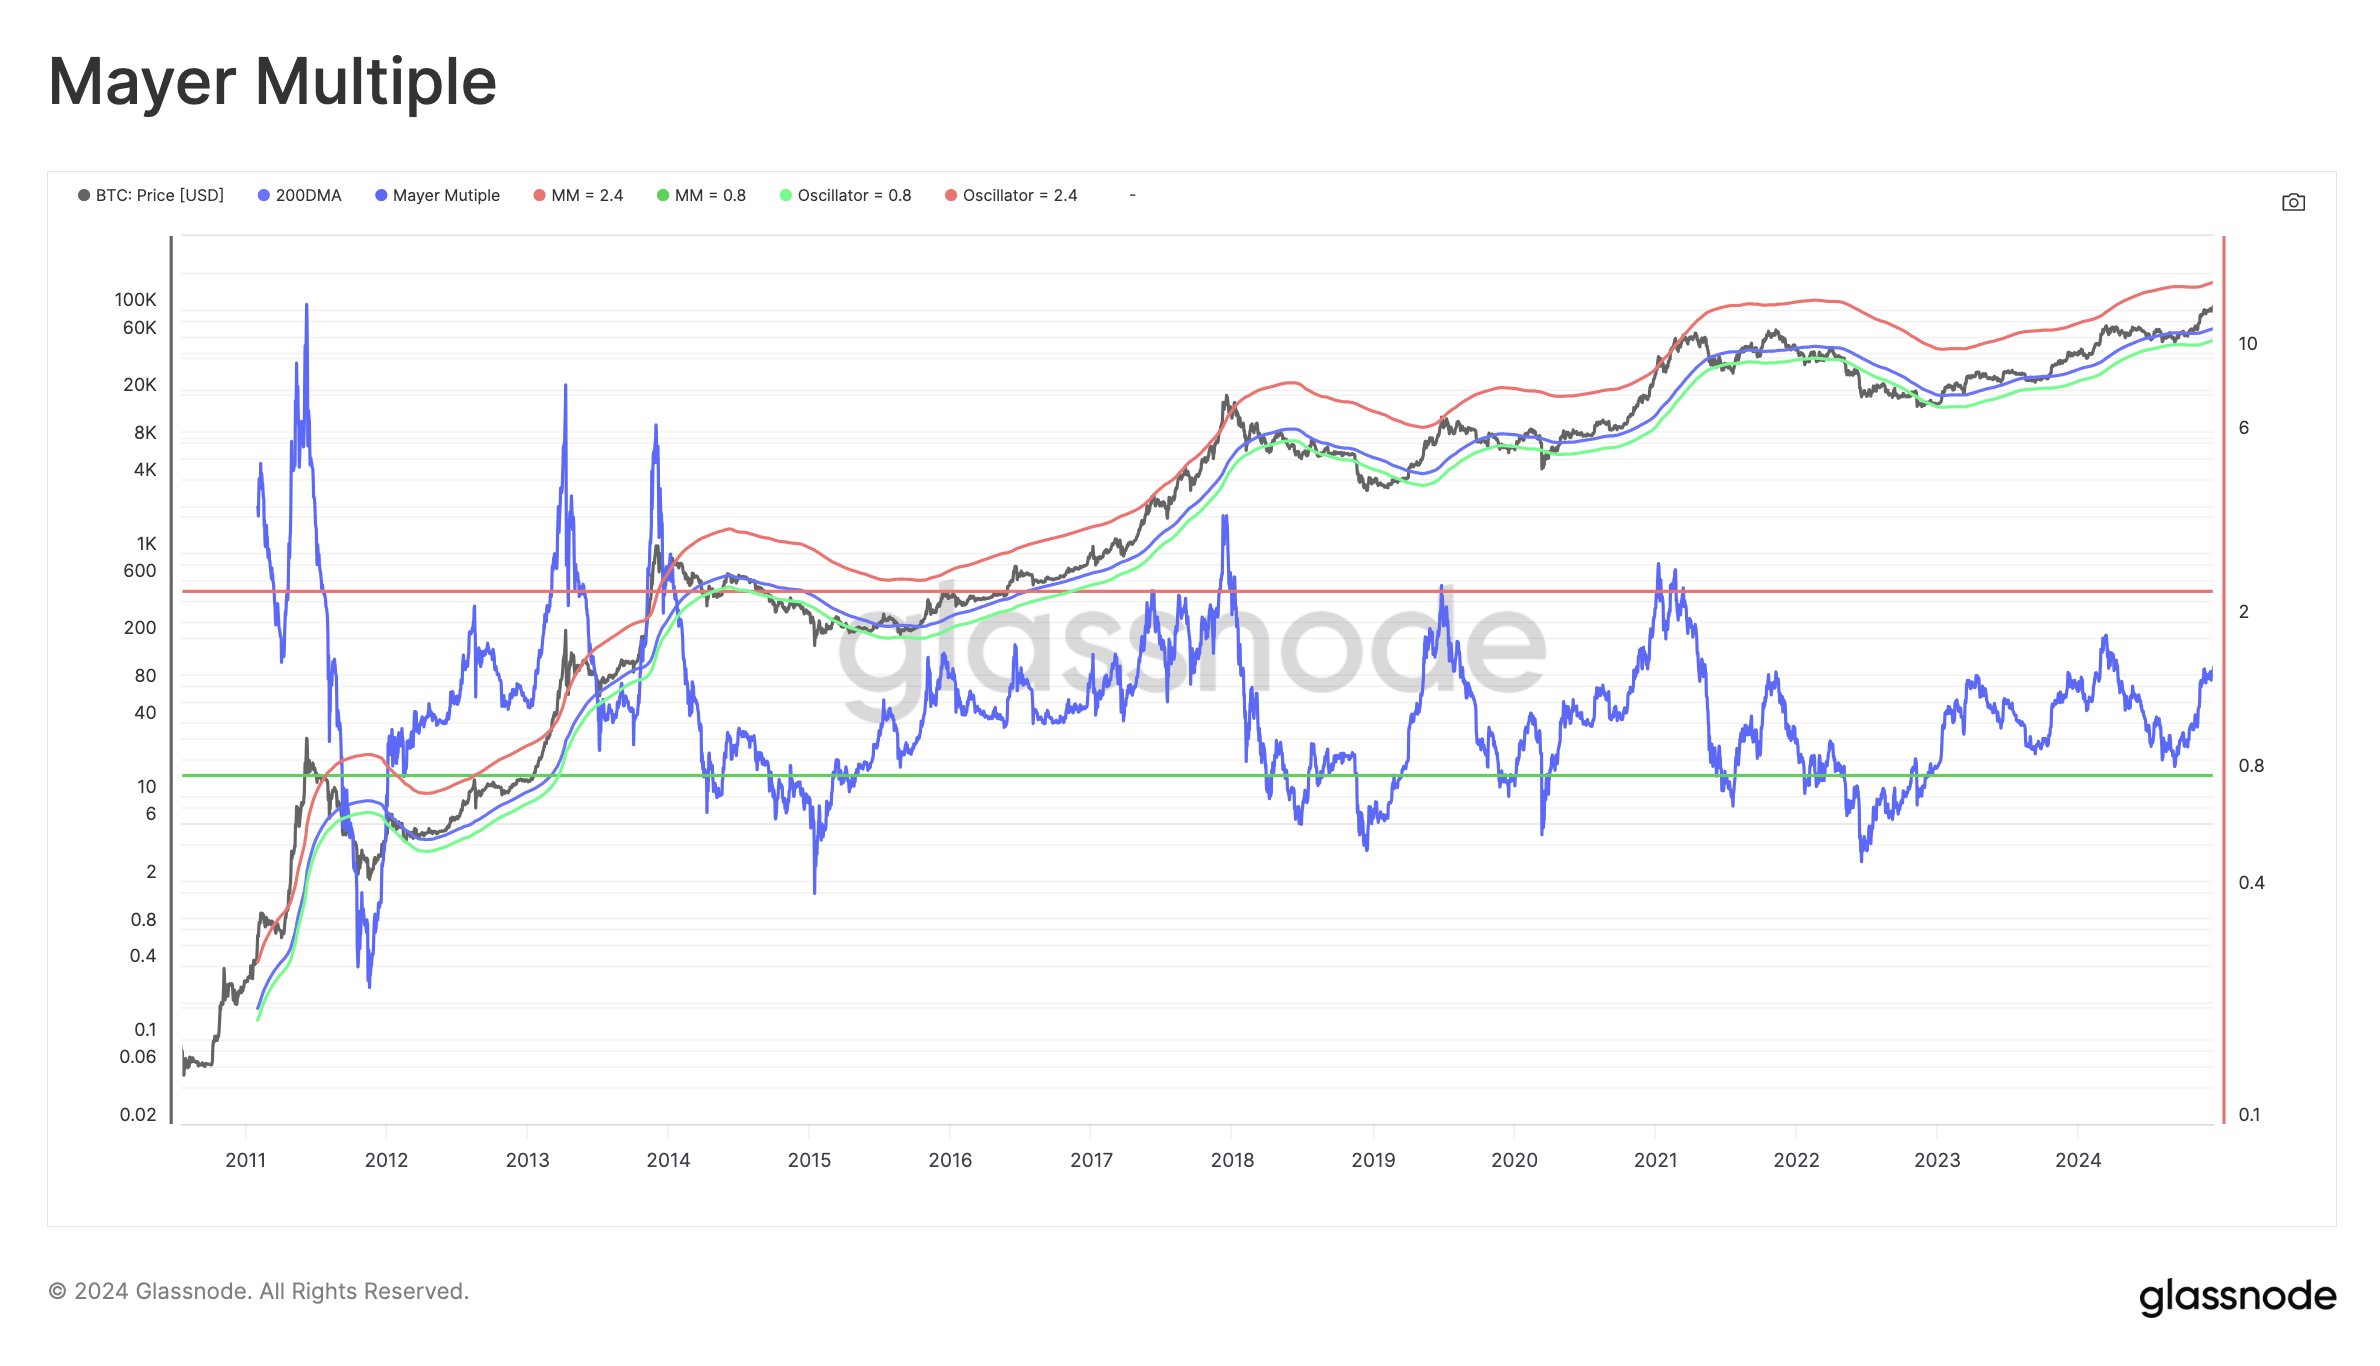
12/ Meyer multiple: Meyerdo Compare the price to the 200-day moving average. Overbought conditions in previous cycles were consistent with values above 2.4. Currently, a Meyer multiple above 2.4 corresponds to a price of about $167,000. With Bitcoin prices below $100,000, this threshold is still far away.
13/ Cycle Extremes Oscillation Chart: This composite indicator uses multiple binary indicators (MVRV, aSOPR, Puell Multiple, Reserve Risk) to represent cycle extremes. “Currently 2/4 has started” means that only half of the overheating market tracking conditions are met. The previous top is consistent with the full set of trigger signals. Therefore, the chart suggests that the cycle has not yet reached the strength of its full peak.
14/ Pi cycle top indicator: A price-based signal that historically identifies cycle peaks by comparing short-term and long-term moving averages. “Currently, the short-term moving average is well below the larger moving average ($74,000 vs. $129,000),” Schultze-Kraft said, indicating that there is no crossover and therefore no classic top signal.
15/ Sell-side Risk Ratio (LTH version): This ratio compares total realized profits and losses to realized market capitalization. High value is associated with volatile late-stage bull markets. “The interesting area is 0.8% and above, and we’re at 0.46% now – there’s still room for growth,” Schultze-Kraft explained. This means that despite the recent profit-taking, the market has not yet entered the area of intense selling pressure commonly seen near tops.
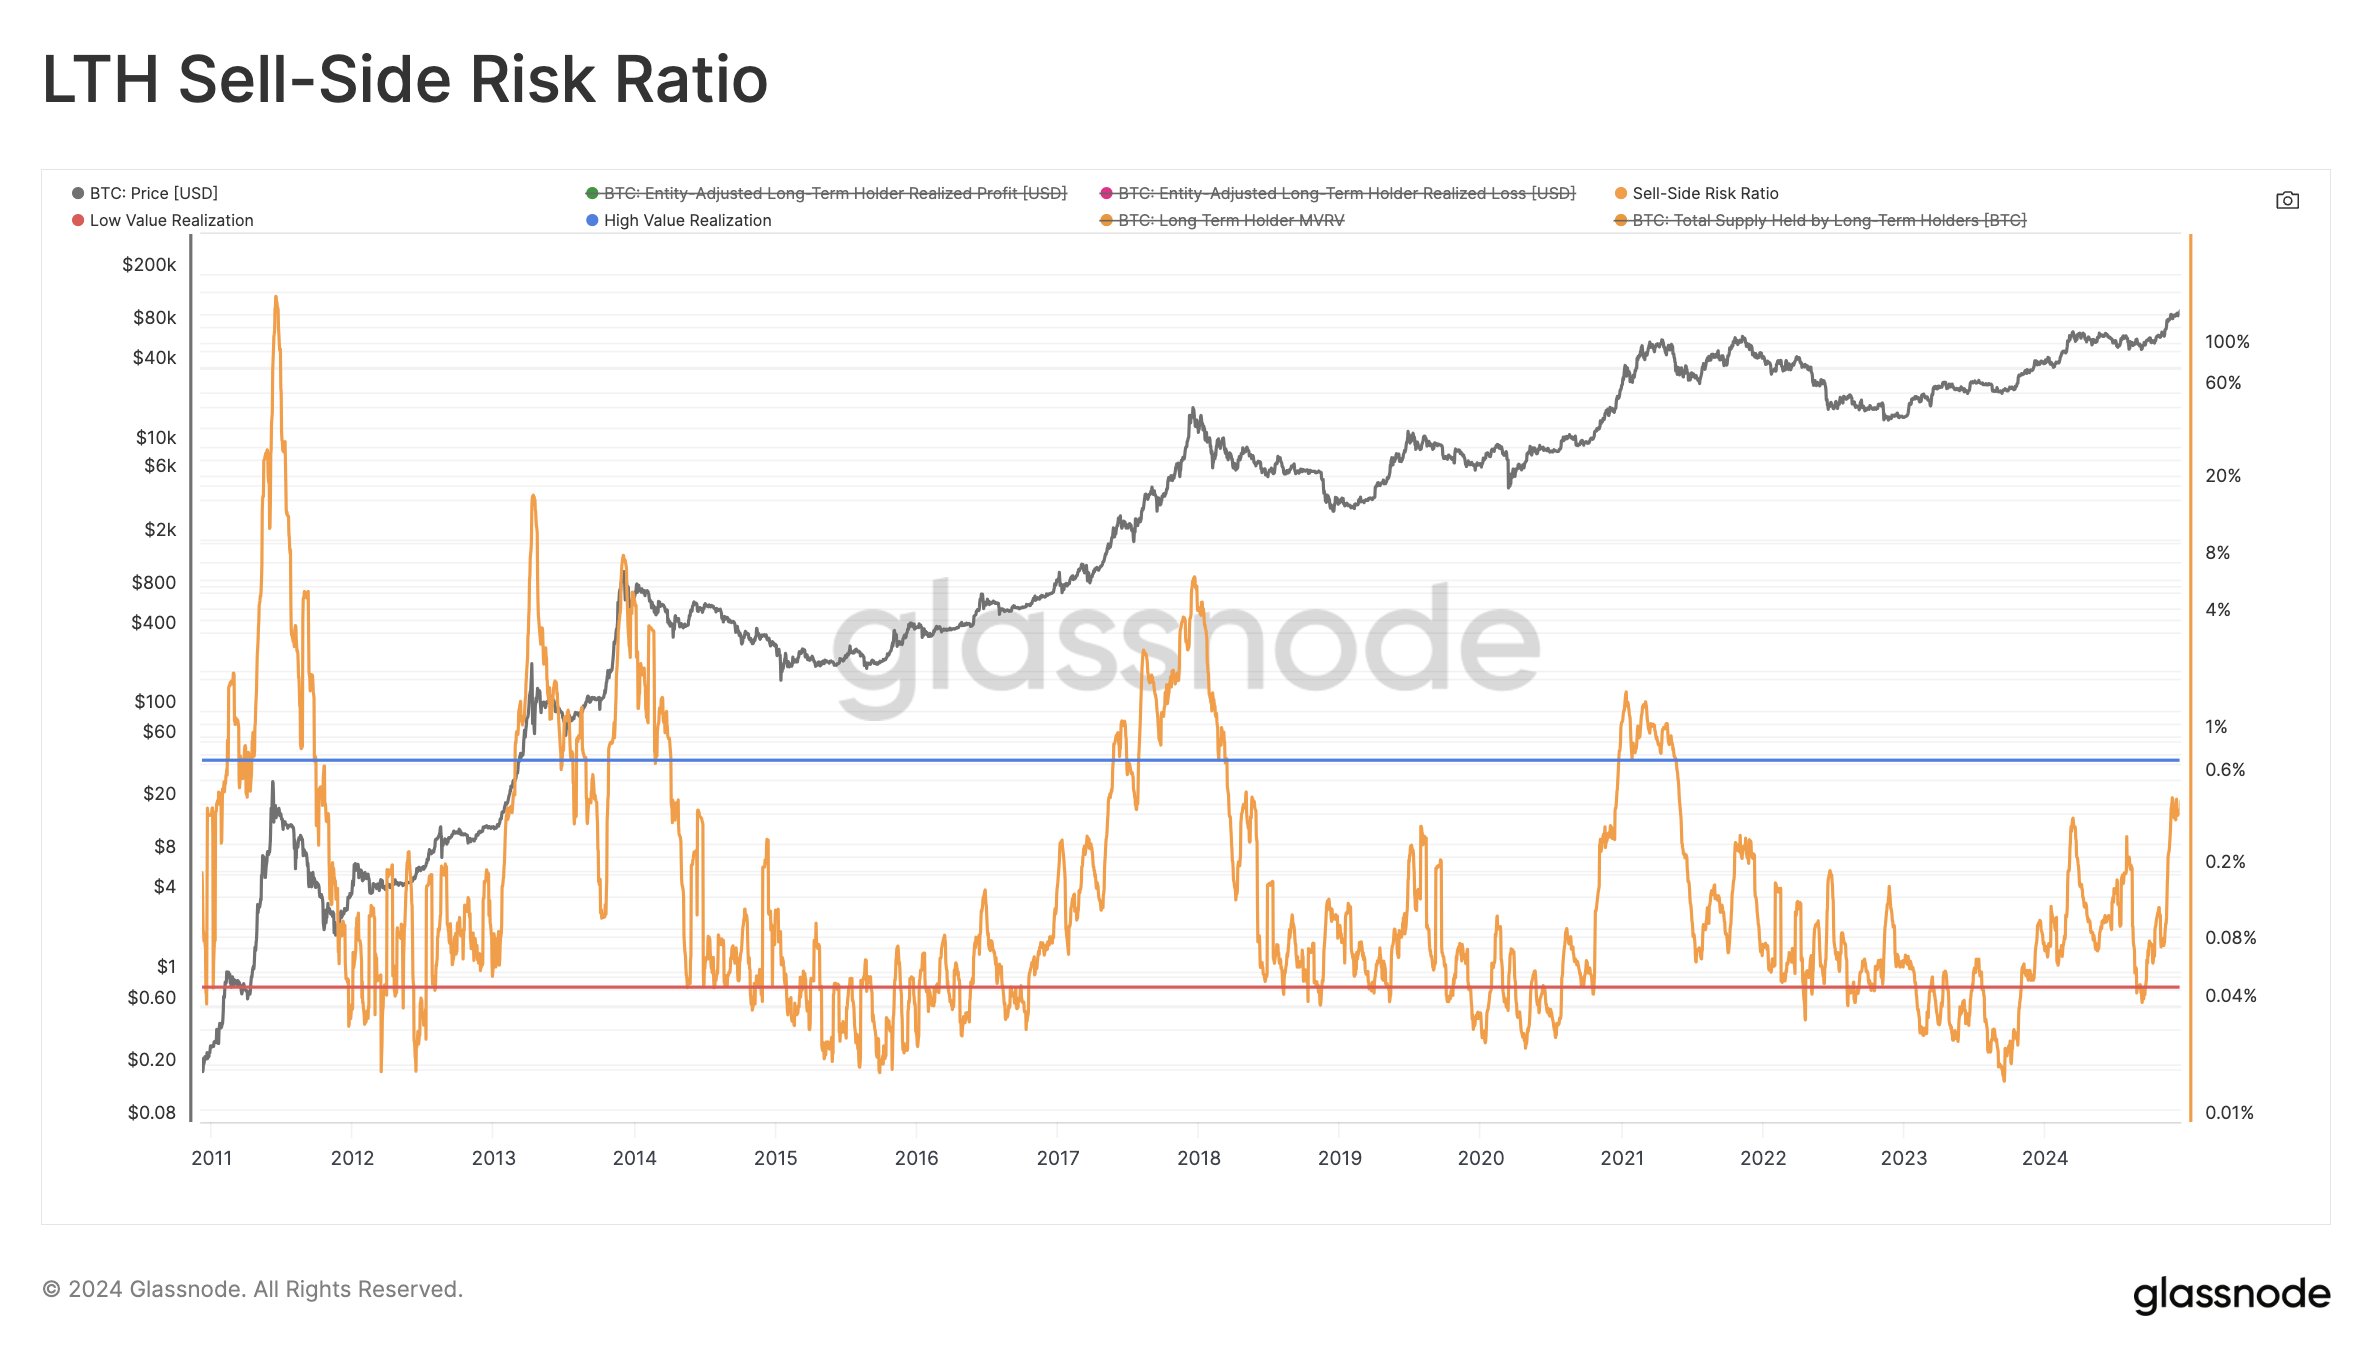
16/ LTH Inflation: Schultze-Kraft highlighted to long-term holders that the inflation rate is “by far the most pessimistic chart I have ever seen.” While he didn’t provide specific target values or thresholds in this excerpt, he said it was “an abundance of caution.” Investors should watch this closely, as it could signal increased allocations from long-term holders or other structural headwinds.
17/ STH-SOPR (Short-Term Holders Spending Output Profit Margin): This indicator measures the profit-taking behavior of short-term holders. “There’s an uptick now, but it’s not sustained,” Schultz-Kraft noted. In other words, while short-term players are taking profits, the data has yet to show the sustained, aggressive profit-taking that is typical of market tops.
18/ SLRV Ribbons: These ribbons track trends in realized value in the short and long term. Historically, when two moving averages peak and cross, it signals a turning point in the market. “Both moving averages are still trending upward and just turned bearish at the tops and crossovers. There is no sign of a top at this time,” Schultz-Kraft said.
Overall, Schultz-Kraft stresses that these metrics should not be used in isolation. “Never rely on a single data point—fusion is your friend,” he advises. He acknowledged that this is an incomplete list and that Bitcoin’s evolving ecosystem — now with ETFs, regulatory clarity, institutional adoption and geopolitical factors — may make historical comparisons less reliable. “This cycle may look very different, but the (historical) data is what we have,” he concluded.
While numerous indicators suggest the Bitcoin market is moving into more optimistic and profitable territory, few have reached the historical extremes that marked the tops of previous cycles. Indicators such as MVRV, profitability ratios, heat indicators, and various price-based models generally indicate “room for growth,” although at least one indicator (LTH inflation) raises red flags. Some composite signals are only partially triggered, while classic top signals (e.g. Pi Cycle Top) remain inactive.
At press time, BTC was trading at $96,037.
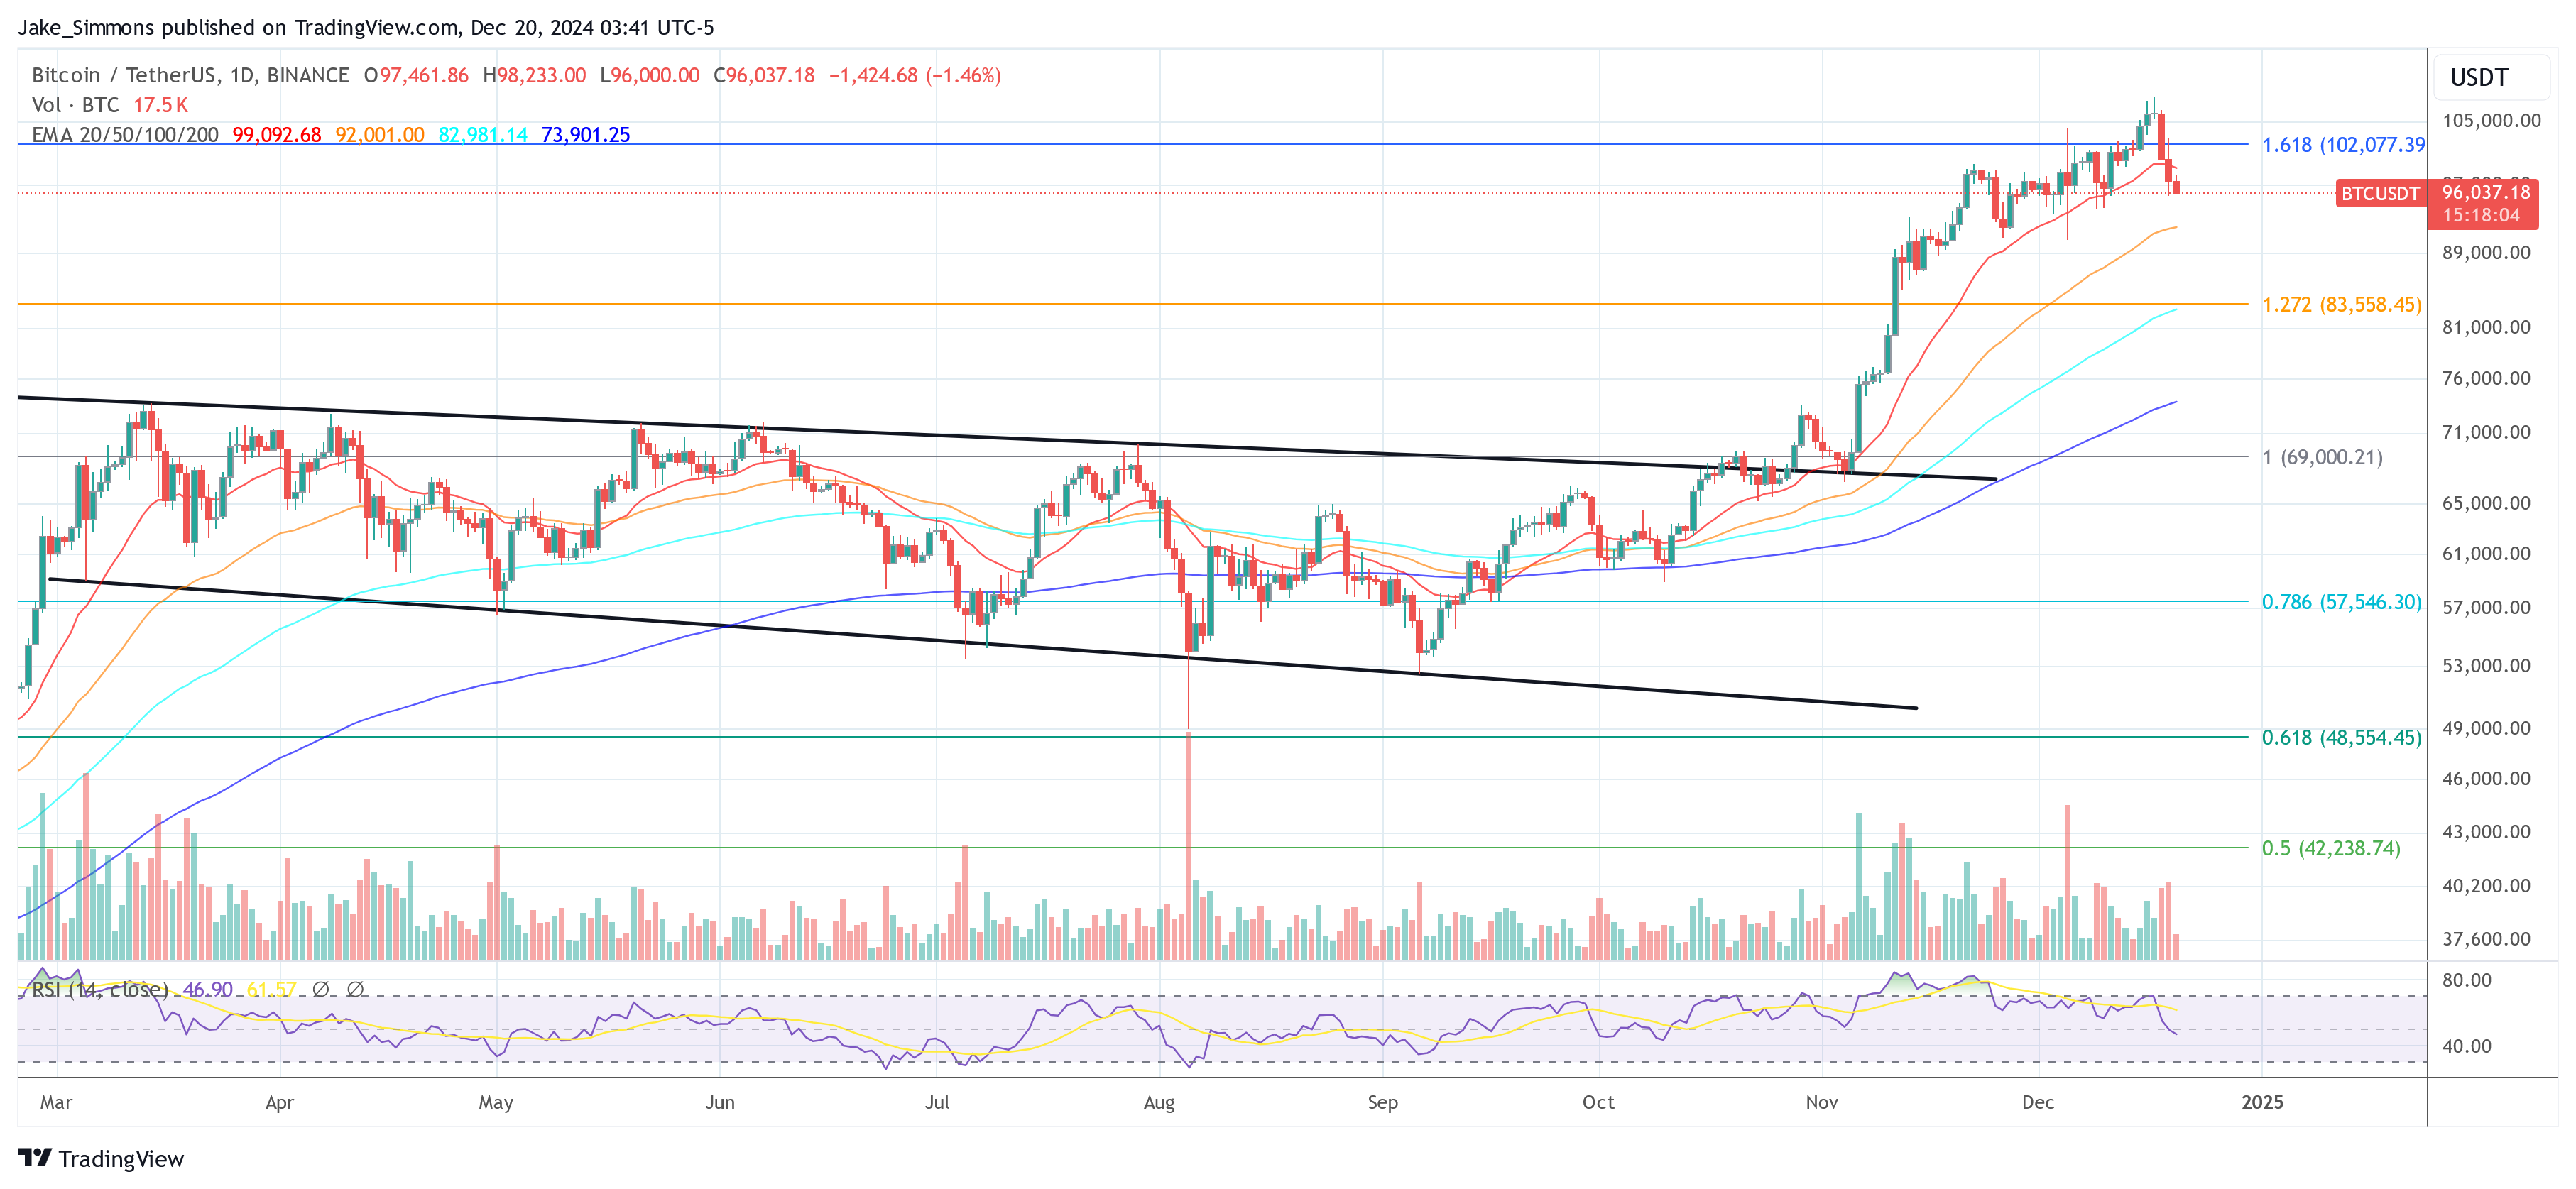
Featured image created using DALL.E, chart from TradingView.com


