XRP Price Gears Up: Is a Fresh Rally on the Horizon?
Despite the pressure on Bitcoin, XRP price started a fresh surge above $2.50. The price is still showing positive signs and is expected to break further above the $2.550 resistance.
- XRP price increased by more than 10% and moved above the $2.50 area.
- The price is currently above $2.450 and the 100 hourly simple moving average.
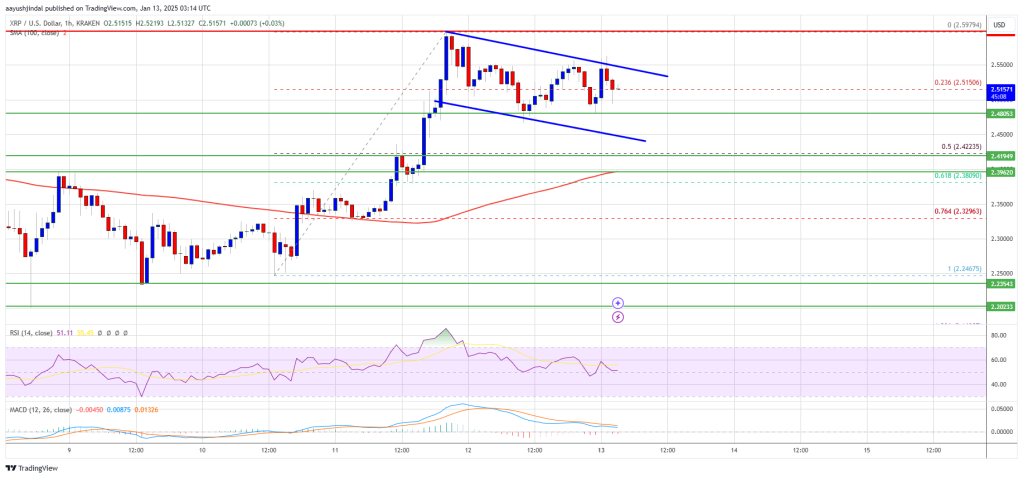
- A short-term bullish flag formation is forming with resistance at $2.550 on the hourly chart of the XRP/USD pair (data source: Kraken).
- If the pair holds above the $2.40 support, it could start a fresh leg higher.
XRP Price Remains in Uptrend Above $2.40
XRP price started a fresh rise above the $2.42 and $2.45 resistance levels. Price increase of more than 10%, outperforming both Bitcoin and Ethereum. The price rose above $2.50 and $2.550.
The price reached as high as $2.5979 and is currently consolidating gains. There were minor moves below the $2.55 level. The price fell below the 23.6% Fib retracement level of the upward move from the swing low of $2.246 to high of $2.597.
The price is currently above $2.450 and the 100 hourly simple moving average. On the upside, the price may face resistance near $2.550. There is also a short-term bullish flag forming with resistance at $2.550 on the hourly chart of the XRP/USD pair.
The first major resistance level is near $2.60. The next level of resistance is $2.65. A clear break above the $2.65 resistance could push the price towards the $2.735 resistance. If there is further upside, the price may move towards the $2.80 resistance or even $2.8250 in the short term. The next major obstacle for the bulls is likely to be $2.950.
Downside correction?
If XRP fails to break above the $2.550 resistance zone, it may start another decline. Initial support on the downside is located near $2.4850. The next major support is near the $2.420 level and the 50% Fibonacci retracement level of the upward move from the $2.246 swing low to $2.597 high.
If there is a downside breakout and a close below the $2.420 level, the price may continue its decline towards the $2.350 support. The next major support is near the $2.320 area.
Technical indicators
Hourly MACD – The MACD for XRP/USD is now losing speed in the bullish zone.
Hourly RSI (Relative Strength Index) – The RSI for XRP/USD is currently above the 50 level.
Major support levels – $2.4850 and $2.420.
The main resistance levels – $2.550 and $2.600.


