Key Indicator Signals Buy On XRP 4-Hour Chart – Analyst Predicts A Price Rebound
XRP has been consolidating below the $2.50 mark, leaving investors eager to see if the altcoin is poised to surge again. After a period of bullish momentum early in the cycle, XRP has been holding steady above key support, hinting at the possibility of an imminent rally.
Top analyst Ali Martinez recently shared his insights on XRP price action, highlighting technical patterns and signals that could lead to a rise in the coming days. Martinez’s analysis is in line with the cautious optimism permeating the market as altcoins like XRP prepare to synchronize with broader market trends.
Related reading
However, market sentiment remains tied to Bitcoin’s performance, BTC is still trying to regain the $100,000 mark. Many investors view Bitcoin’s next move as a potential catalyst for the entire cryptocurrency market. Ahead of this, there is cautious optimism for XRP and other altcoins, with traders keeping a close eye on resistance levels and key technical indicators.
The next few days may determine the direction of XRP as it tests its ability to break out of consolidation and chart a bullish course. As markets show signs of recovery, investors remain vigilant, balancing excitement with caution.
XRP is about to enter the price discovery phase
XRP is gearing up for a potential breakout, with the market expected to rebound from current levels. The focus of the cryptocurrency community has turned to XRP as it consolidates below resistance and shows signs of being poised for a strong move higher – optimism fueled by technical signals and broader market expectations of a recovery across the cryptocurrency space.
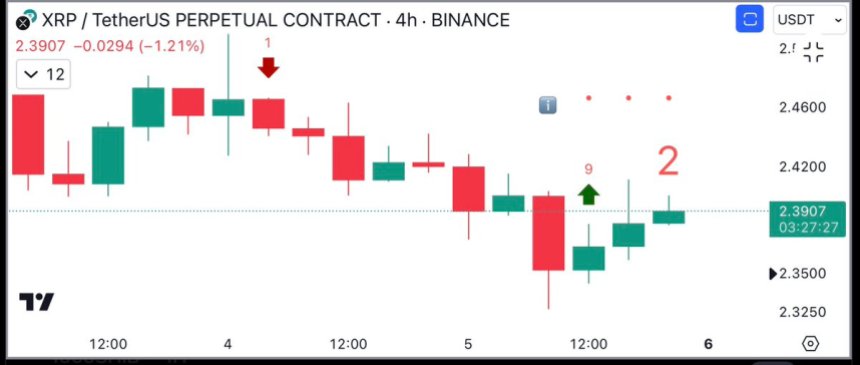
Top analyst Ali Martinez has highlighted key developments in XRP price action. According to Martinez’s technical analysisthe TD Sequential indicator has issued a buy signal on the XRP 4-hour chart, indicating that the price may rebound. The TD Sequential is a highly regarded technical tool used by traders to identify potential reversals or trend exhaustions, often signaling when an asset is ready to deviate from its current trajectory.

This buy signal is a significant bullish indicator and suggests that XRP may rise higher in the coming days. As the market braces for this potential rally, XRP investors are watching closely to see if the asset can return to its yearly highs and decisively enter a phase of price discovery.
Related reading
To maintain the momentum of the current bull cycle, XRP must clear its resistance levels and sustain the breakout. The next few days will be key for XRP’s movement as market sentiment shows cautious optimism. If it successfully enters the price discovery space, it could set the stage for a massive rally, making the altcoin a key player in the evolving cryptocurrency market landscape.
Price action looks strong
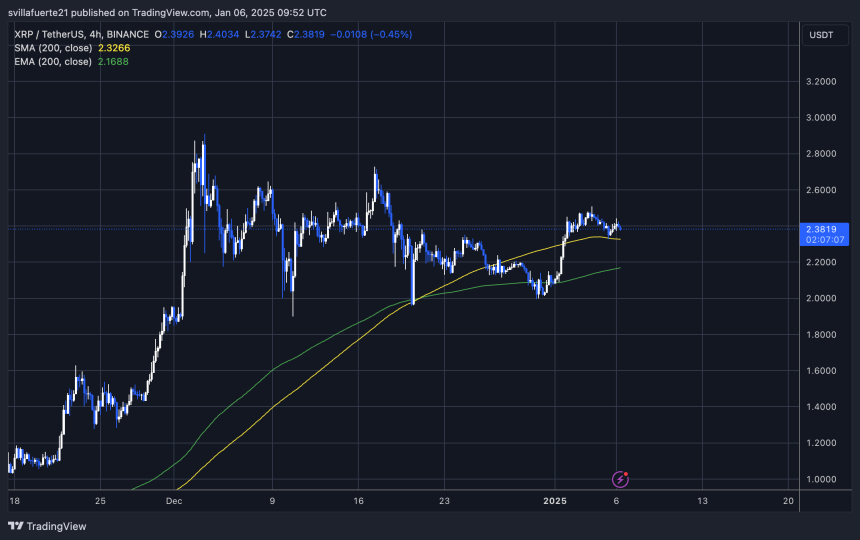
XRP is trading at $2.38, showing resilience after regaining and holding the 4-hour 200 moving average at $2.33. This key technical level is a strong indicator of short-term strength, suggesting that XRP may be headed for a significant rise. As the price stabilizes above this moving average, traders’ bullish sentiment is growing.

The current price action highlights XRP’s ability to defend key support levels, suggesting buyers are stepping in to prevent further losses. If the bullish momentum continues, XRP may start to rebound significantly in the coming days. The key level to watch is the $2.70 mark. Retaking this level and holding it as support would confirm a breakout, paving the way towards new highs.
However, if XRP fails to break above $2.70, the market may see an extended period of sideways trading. While this will delay a potential rally, it will also provide a basis for accumulation and set the stage for a stronger breakout in the future.
Related reading
The next few days will be crucial for the direction of XRP as market conditions remain dynamic. A confirmed breakout above $2.70 could mark the beginning of a strong bullish phase, solidifying its position in the ongoing recovery in the cryptocurrency market.
Featured image from Dall-E, chart from TradingView


